DZH International Chart Help
|
A. Technical Chart
- Overview
- Candlestick Bar
- Settings (Modify Color, Font size...etc)
- Search & Change Symbol
- Advance Search
- Zoom in/out and scroll chart
- Adding Indicators
- Customize Indicator Toolbar
- Add Trendlines Drawing
- Remove Trendlines Drawing
|
| A. Technical Chart |
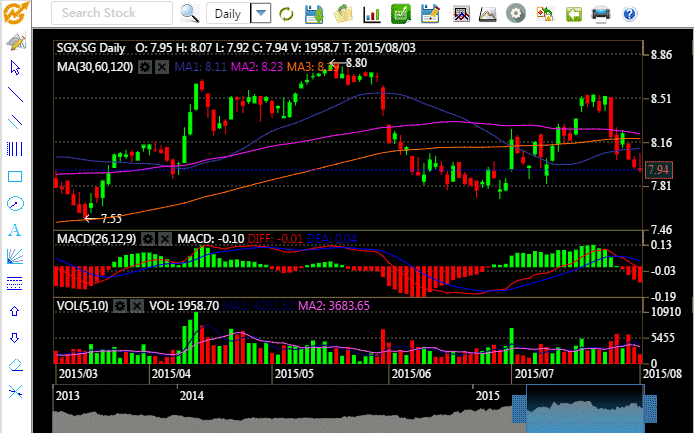
| 1. Overview |
| |
| |
 |
Quick search symbol button. |
 |
Advance search button |
 |
Chart period (daily, 5 minutes... Etc). |
 |
Reload chart button. |
 |
Save chart button. |
 |
Open saved chart button. |
 |
Chart type (line, candlestick and OHLC bar). |
 |
Add indicator button. |
 |
Save template button.(user can save up to 3 template) |
 |
Open saved template. |
 |
Add symbol and displayed chart as performance chart. |
 |
Change chart setting. (Front, color.. etc) |
 |
Export chart button. |
 |
Reset chart setting to system default. |
 |
Print button. |
 |
Others Drawing tools buttons. |
 |
Pointer button. |
 |
Draw trendline button. |
 |
Copy last trendline button. |
 |
Draw Fibonacci Cycle button. |
 |
Draw rectangle shape button. |
 |
Draw circle shape button. |
 |
Add annotation button. |
 |
Draw Gann Fan button. |
 |
Draw Fibonacci Retracement button. |
 |
Draw up arrow shape button. |
 |
Draw down arrow shape button. |
 |
Delete drawing button. |
 |
Delete all drawing button. |
|
| |
| 2. Candlestick Bar |
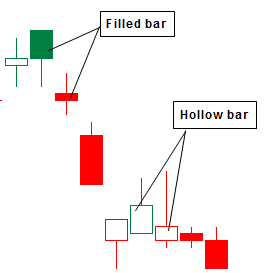
- How to read filled and hollow candlestick bar:
1. Filled Bar - Closing price of current bar is lower than Opening price of the current bar. (Close < Open)
2. Hollow Bar - Closing price of current bar is higher than Opening price of the current bar. (Close > Open)
- How to read color on candlestick bar:
1. Green Bar - Closing price for current bar is higher than previous bar closing price. (Current Close > Previous Close)
2. Red Bar - Closing price for current bar is lower than previous bar closing price. (Current Close < Previous Close)
|
| |
| |
| 3. Settings (Modify Color, Font... etc) |
- Click on Settings button, a drop down menu with various Background, Font, CandleStick, Line, Crosshair, Display Cursor Price and Close Line setting will appear.
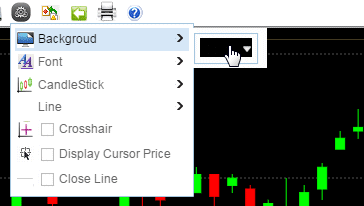
- Click on any color box to change color.
|
| |
| |
| 4. Search and Select a Symbol |
- Click on Quick Search combo box, key in the symbol name to start searching.
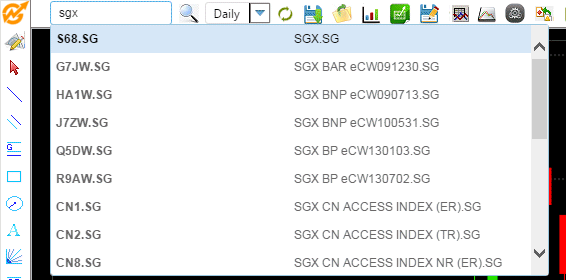
- Once the result appear, click on the symbol to open the chart.
|
| |
| |
| 5. Advance Search |
- Click on Advance Search button on main toolbar will open a Advance Search window.
- Tick the checked box on the exchange you wanted to search. Type in the stock name or symbol code in the combo
box and click on the Search button to start searching.
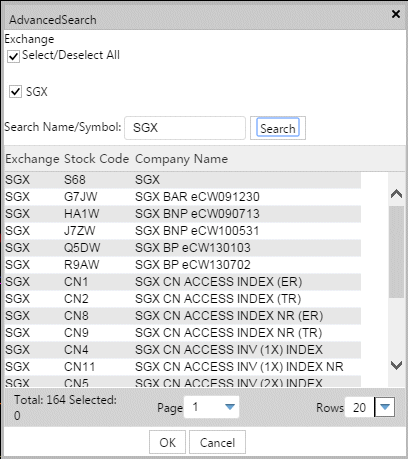
(Each page will only show certain number of results. Please click on Page drop down combo box to go the next page)
|
| |
| |
| 6. Zoom in/out and scroll chart |
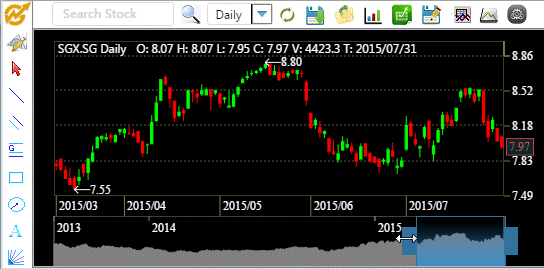
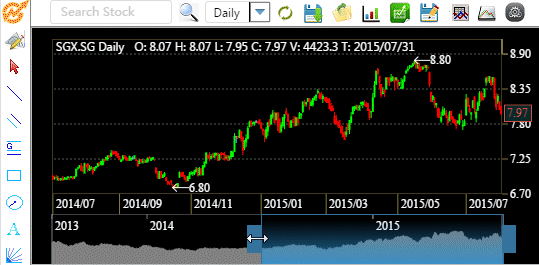
- To zoom in/out in the chart, move your mouse to the left or righ segment of the blue scroll panel at the bottom of the chart. Drag to the left/right to zoom in /out.
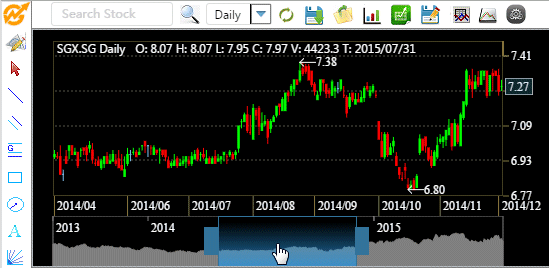
- To scroll the chart to a certain position, move your mouse to the center of the blue scroll panel at the bottom of the chart.
Click and drag left/right to move the chart horizontally.
|
| |
| |
| 7. Adding Indicators |
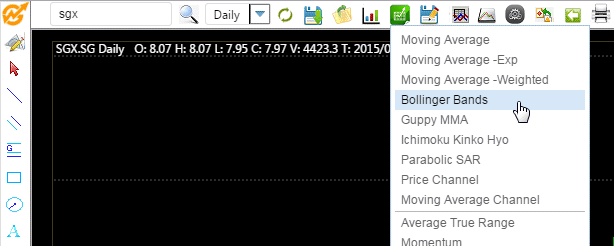
- Click on Indicator button, then click on any indicator to add the indicator.
|
| |
| |
| 8. Customize Indicator Toolbar |
- Click on each Indicators setting button modify the indicator
parameter and color.
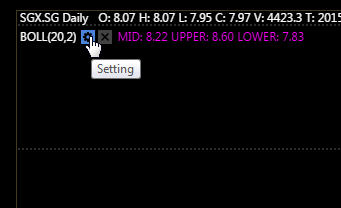
- An indicator setting window will appear. On Inputs, click on any parameter to change the
value. Click on Style to change color and line style.
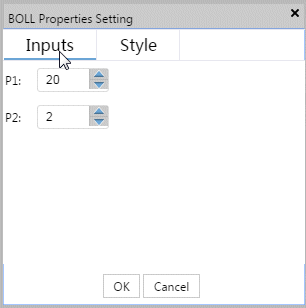

- Click on Ok button save changes.
|
| |
| |
| 9. Add Trendlines Drawing |
- Click on Trendline Tool on the left..
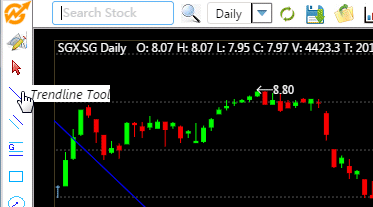
- Click on the 1st Point on the chart and drag the line to the 2nd point and release it to complete the drawing.
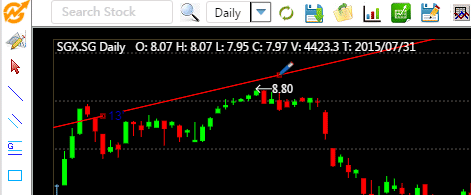
- To add another trendlines tool, repeat steps a - b.
|
| |
| |
| 10. Remove Trendlines Drawing |
- Click on Delete Drawing Line button on the left..
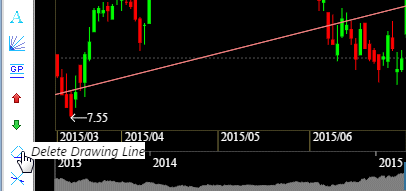
- Mouse over the drawing you wanted to delete and click one time to delete it.
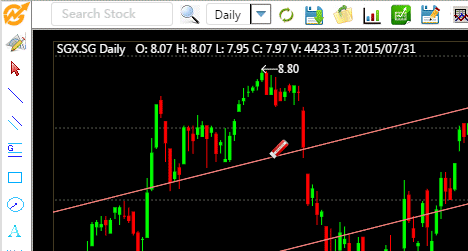
- Click back Pointer button once drawing is deleted.
Notes: Click on Delete All Drawing button to remove all drawing on the chart.
|
| |
| |
| |

